The previous post got me thinking about the level of geographic polarization in 2004 and whether or not it has changed now that President Bush's approval ratings have fallen so significantly. I looked at
Bush's approval ratings in all 50 states (provided by Survey USA) and compared them to Bush's vote in 2004. The following regression graph shows that Bush's decline has been remarkably consistent across all 50 states, with no real outliers. The coefficient for Bush's 2004 vote is .86 and it explains nearly 90 percent of the variance in Bush's 2006 approval ratings.
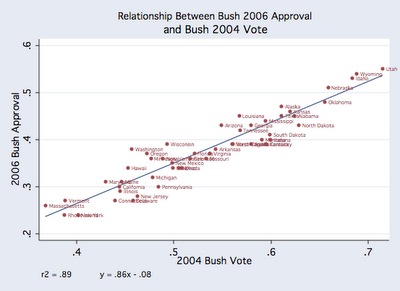
(Click on the graph to see a larger version.)

1 comment:
Isn't this just due to the makeup of each state's population? What if you regressed both x and y to the percentages of Republicans/Democrats/Independents, and took the percent change that each group experienced between those two polls (the 2004 vote and the 2006 survey). I'll bet you come as close to the regression line with these intervening factors.
Post a Comment